Metric Views
Argus rolls your usage up several ways, one per view in the left nav. This page explains what the numbers in each view mean. All of them respect the date range and source filter at the top of the app (see Overview).
Activity
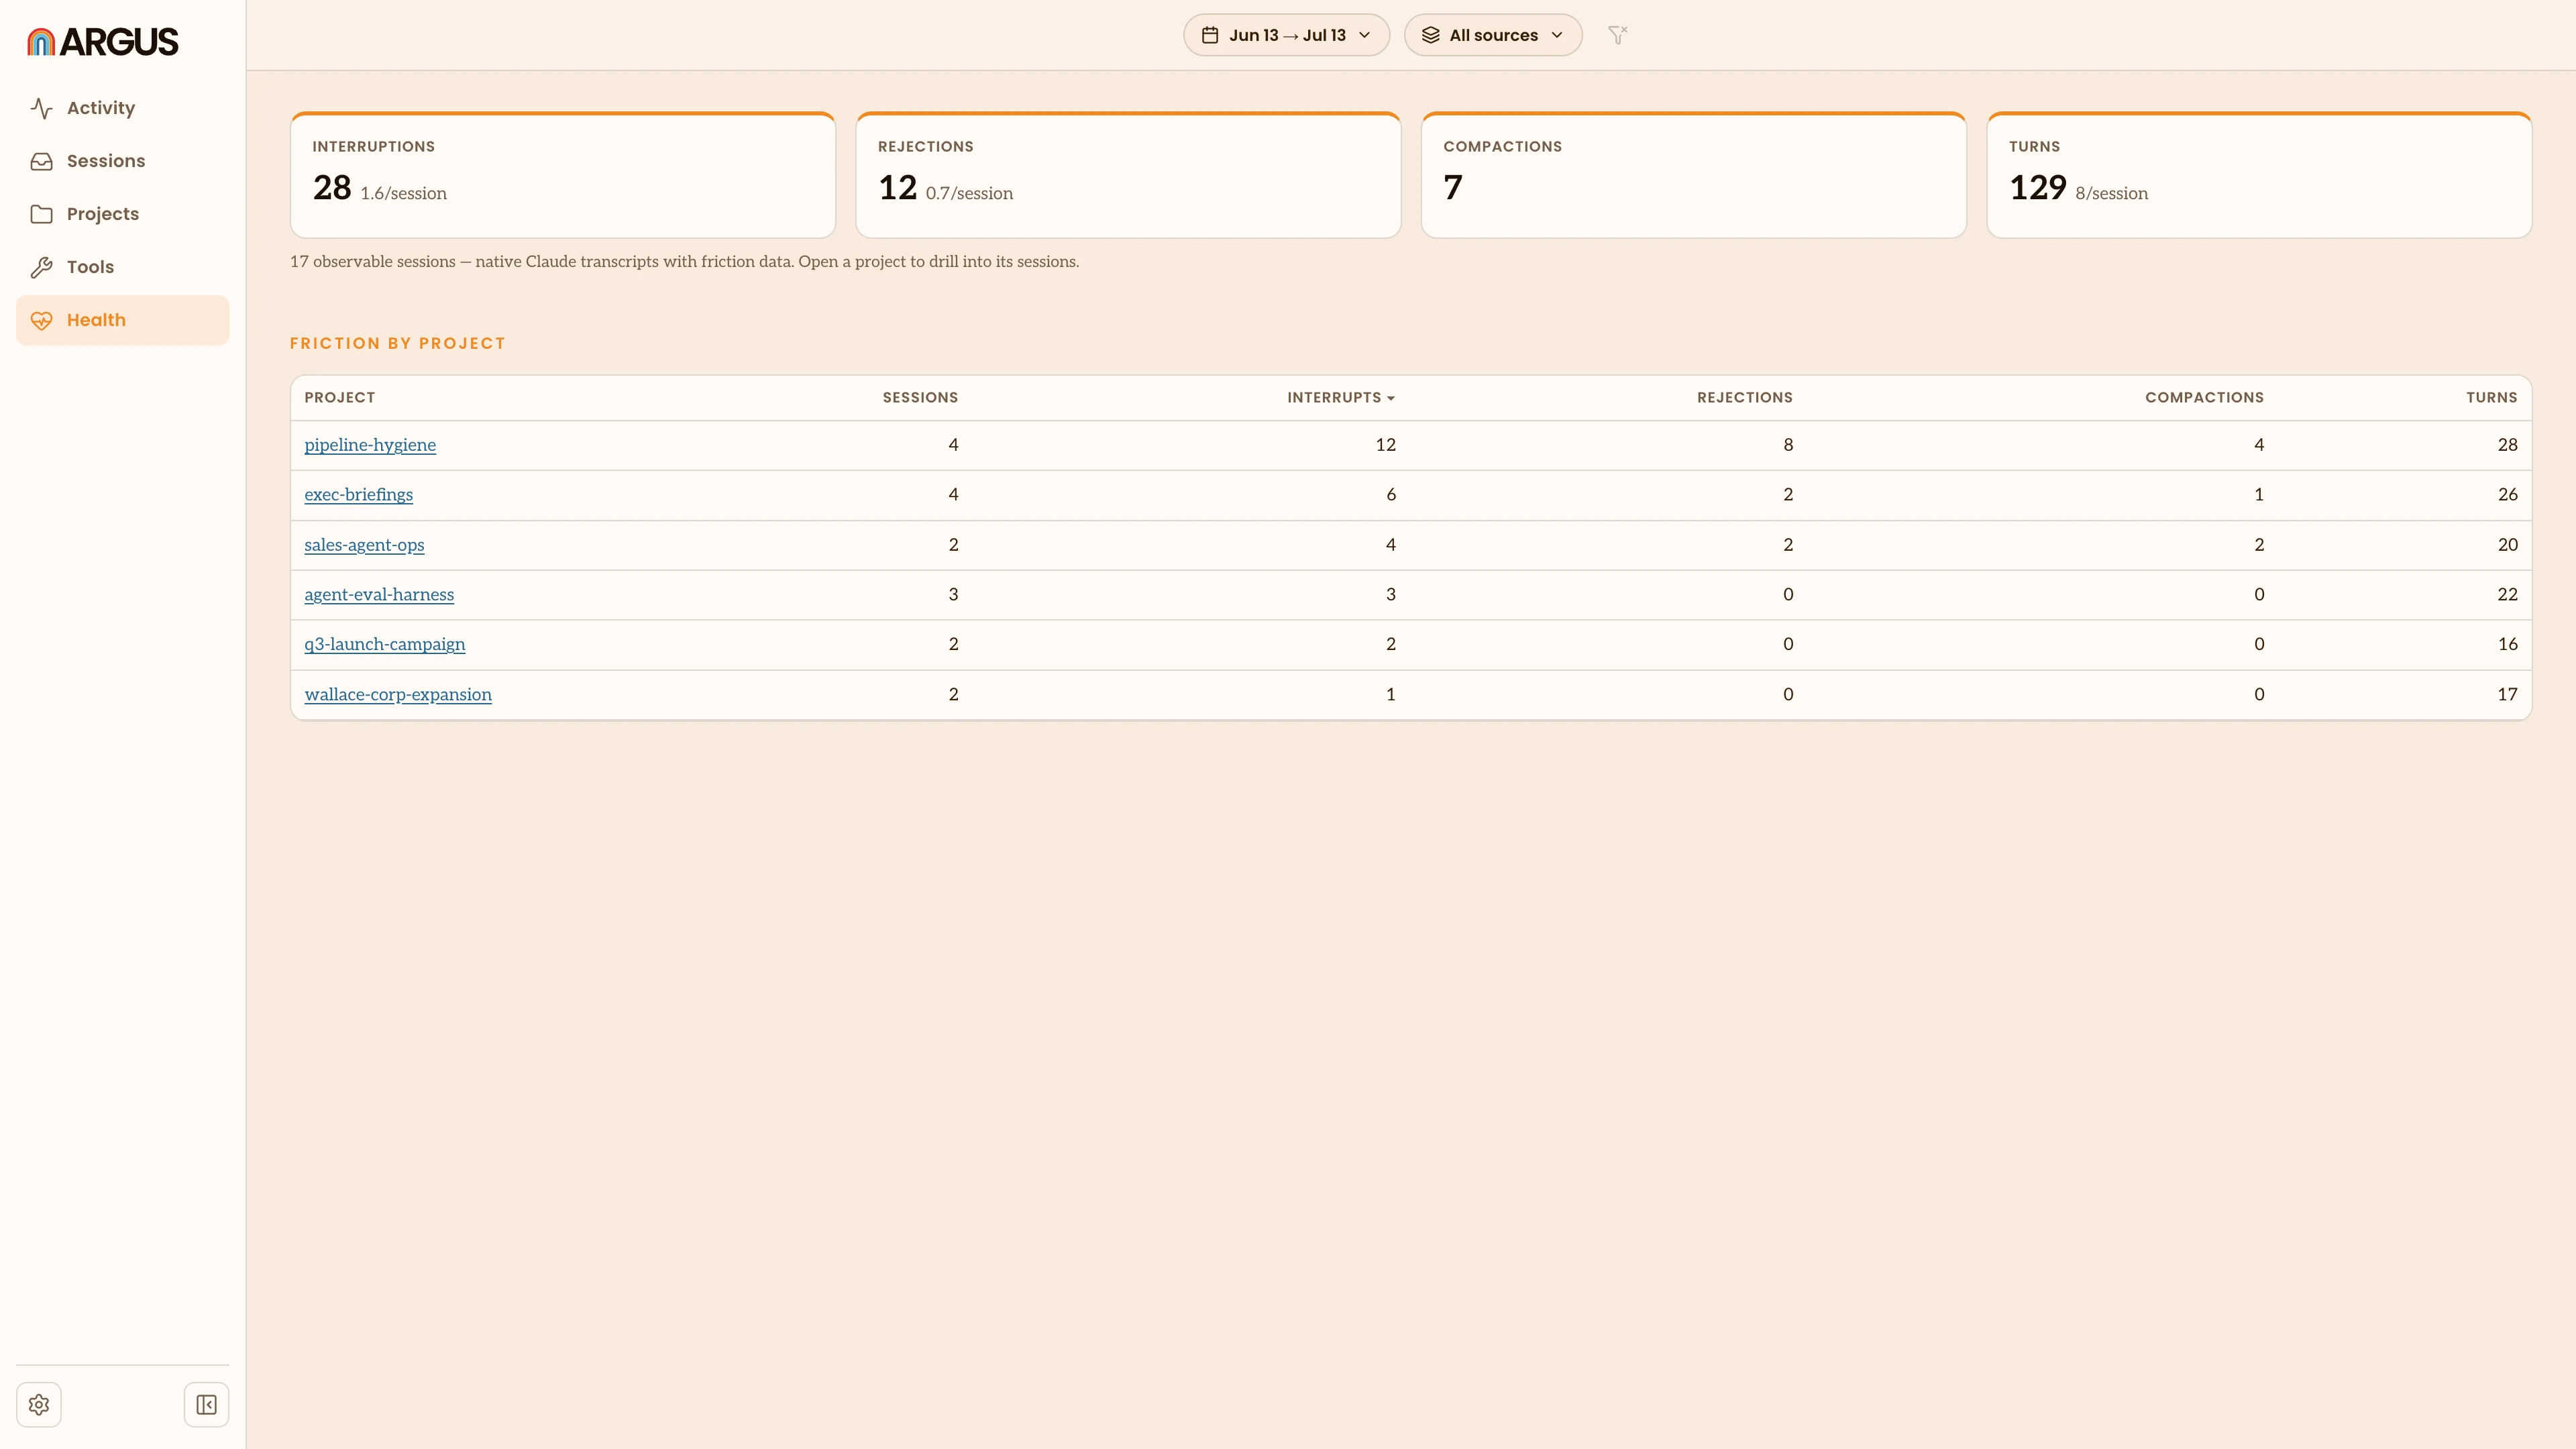
The home view. It opens with headline totals for the range you're looking at:
- Sessions and Model responses: how many sessions you ran and how many replies your agents sent.
- Total tokens and Est. cost: how many tokens moved through your agents and the estimated cost.
- Cache read: the share of input tokens served from cache. A higher number means more of your context was reused rather than reprocessed, which is cheaper.
- Output tokens: how many tokens your agents wrote back.
Below the totals:
- Recommendations are things Argus noticed that may be worth acting on, like plugins you've enabled but never use, or sessions where context grew unusually fast. A credential warning leads the list when Argus finds one, and links to the sessions it applies to.
- Trends plot your tokens per day and cost per day across the range.
- Sources breaks your usage down by agent, as charts and a table you can sort.
- Models shows your token use by model over time.
Projects
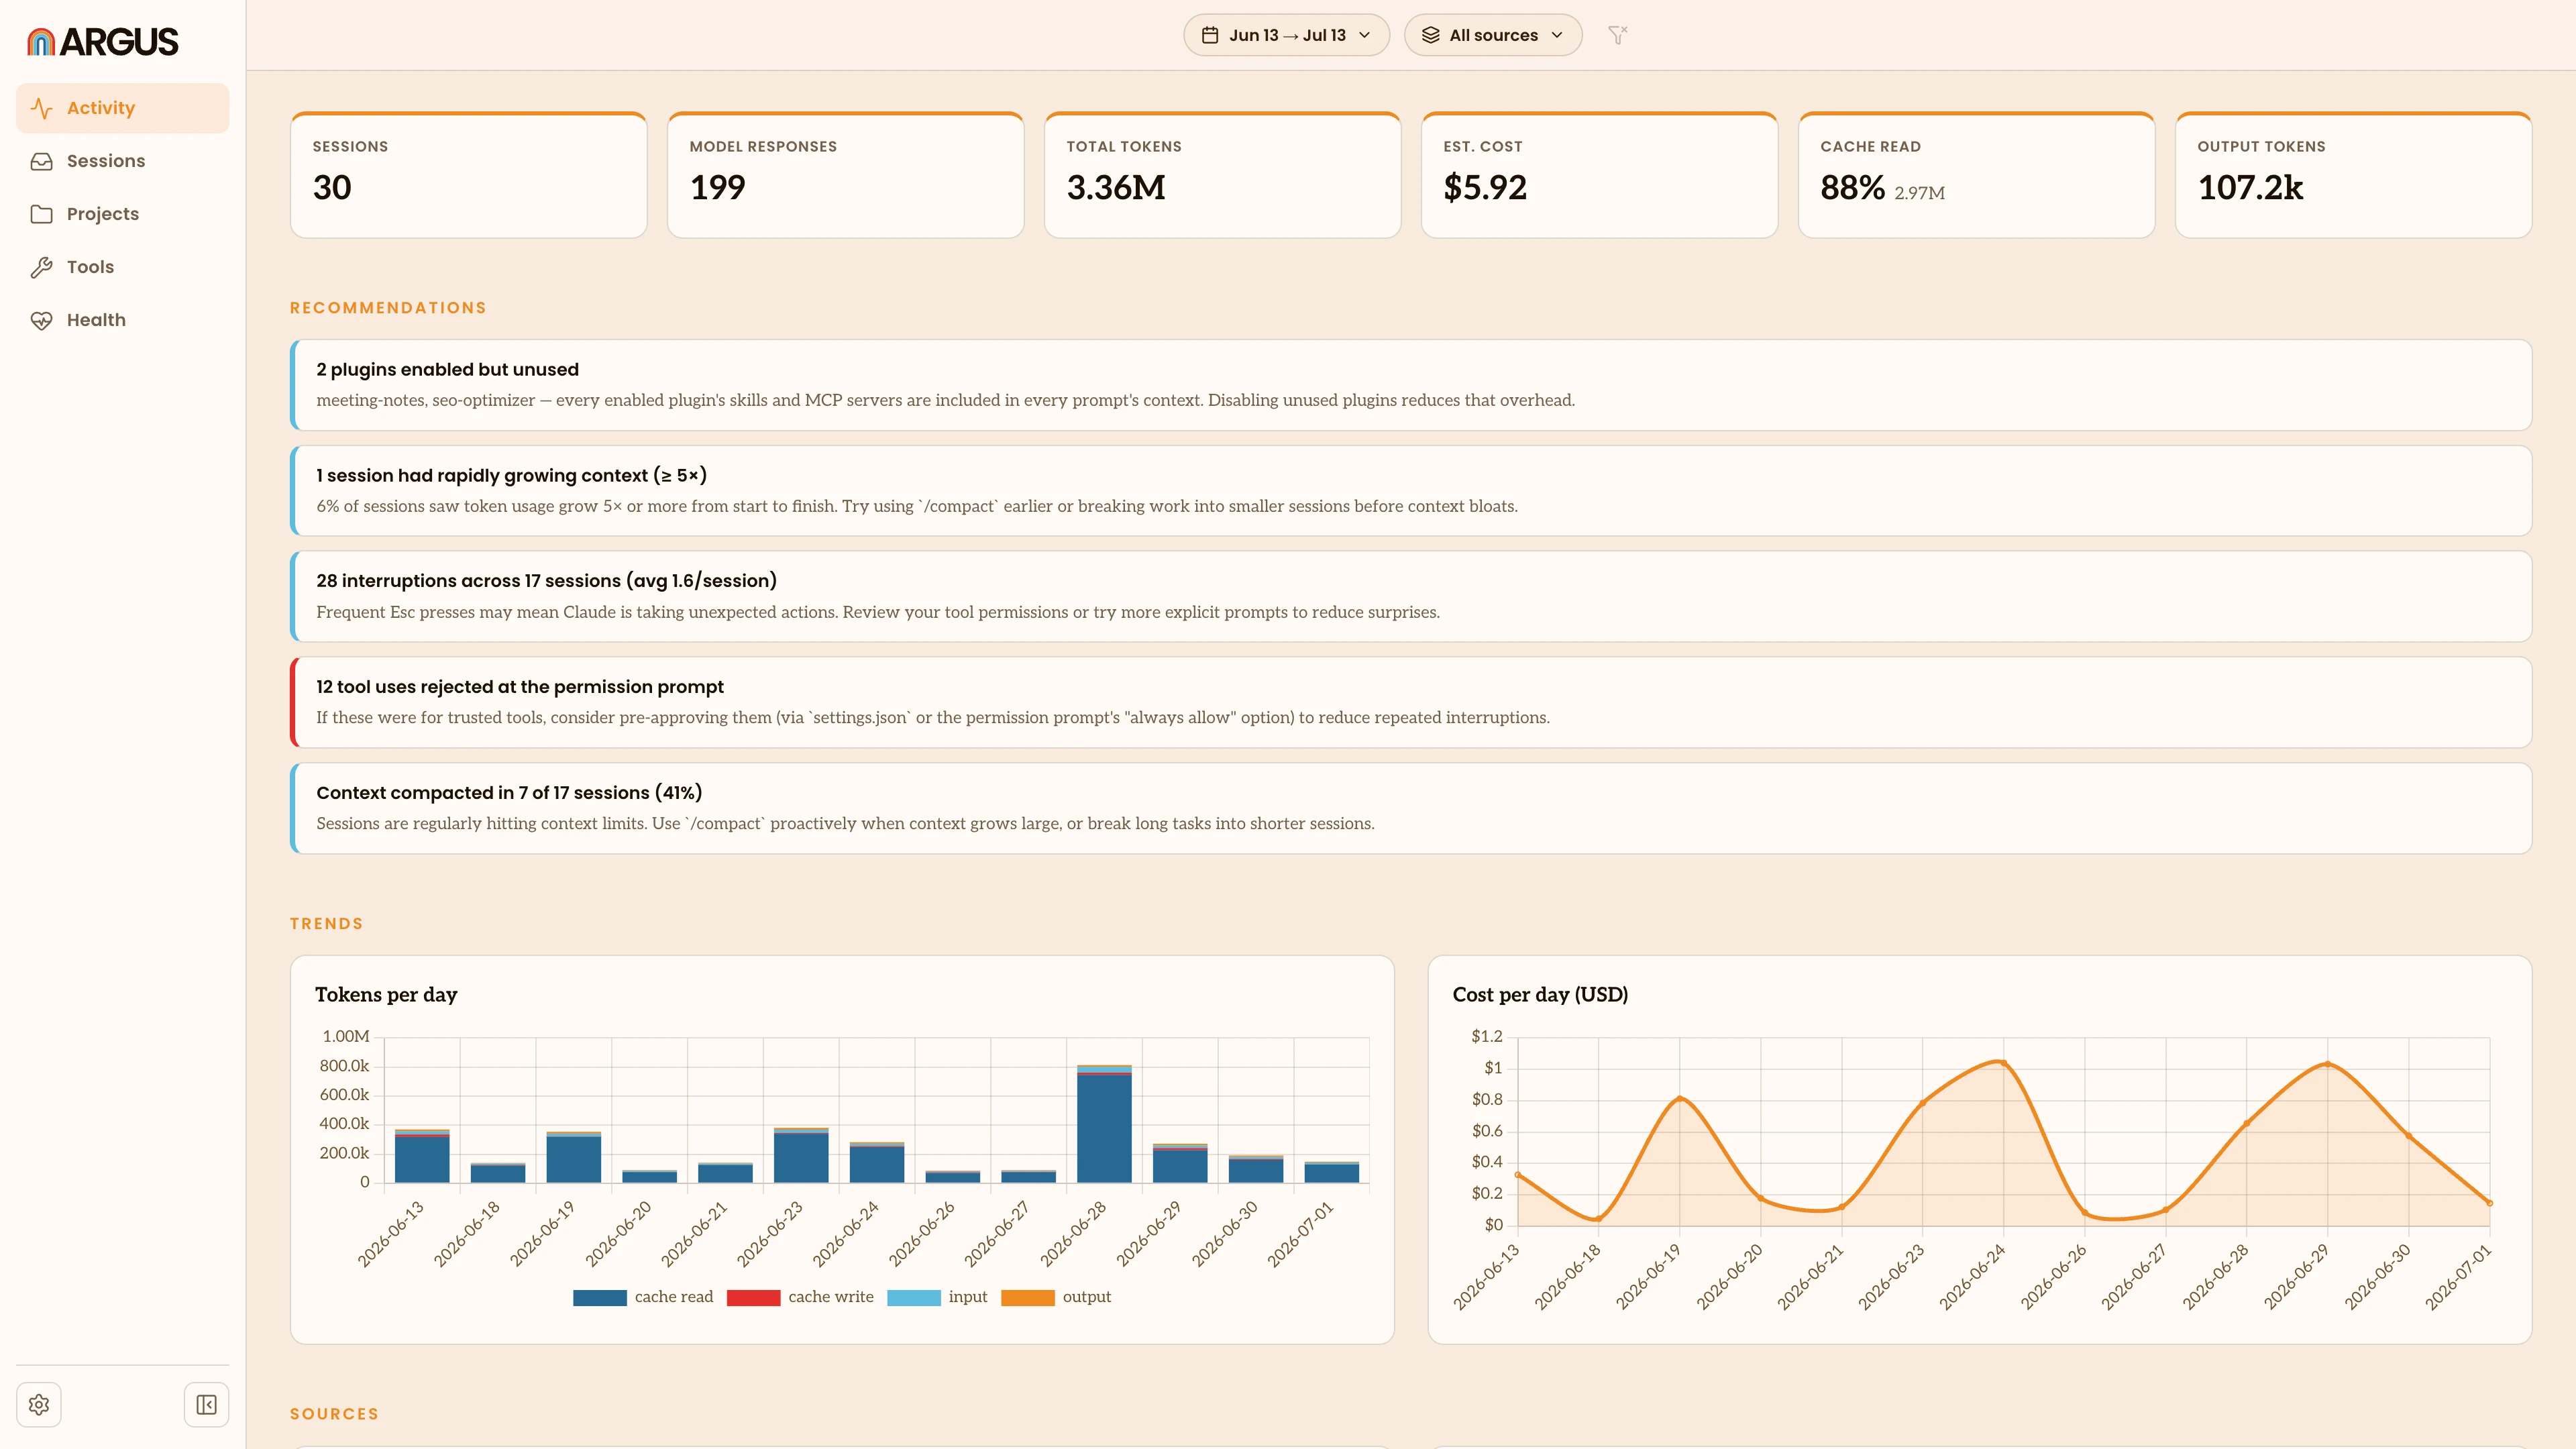
Your usage grouped by project, the folder an agent was working in. Charts rank your projects by tokens and by cost, and a table lists them all with their session, response, token and cost totals. Click a project to open its sessions.
Tools
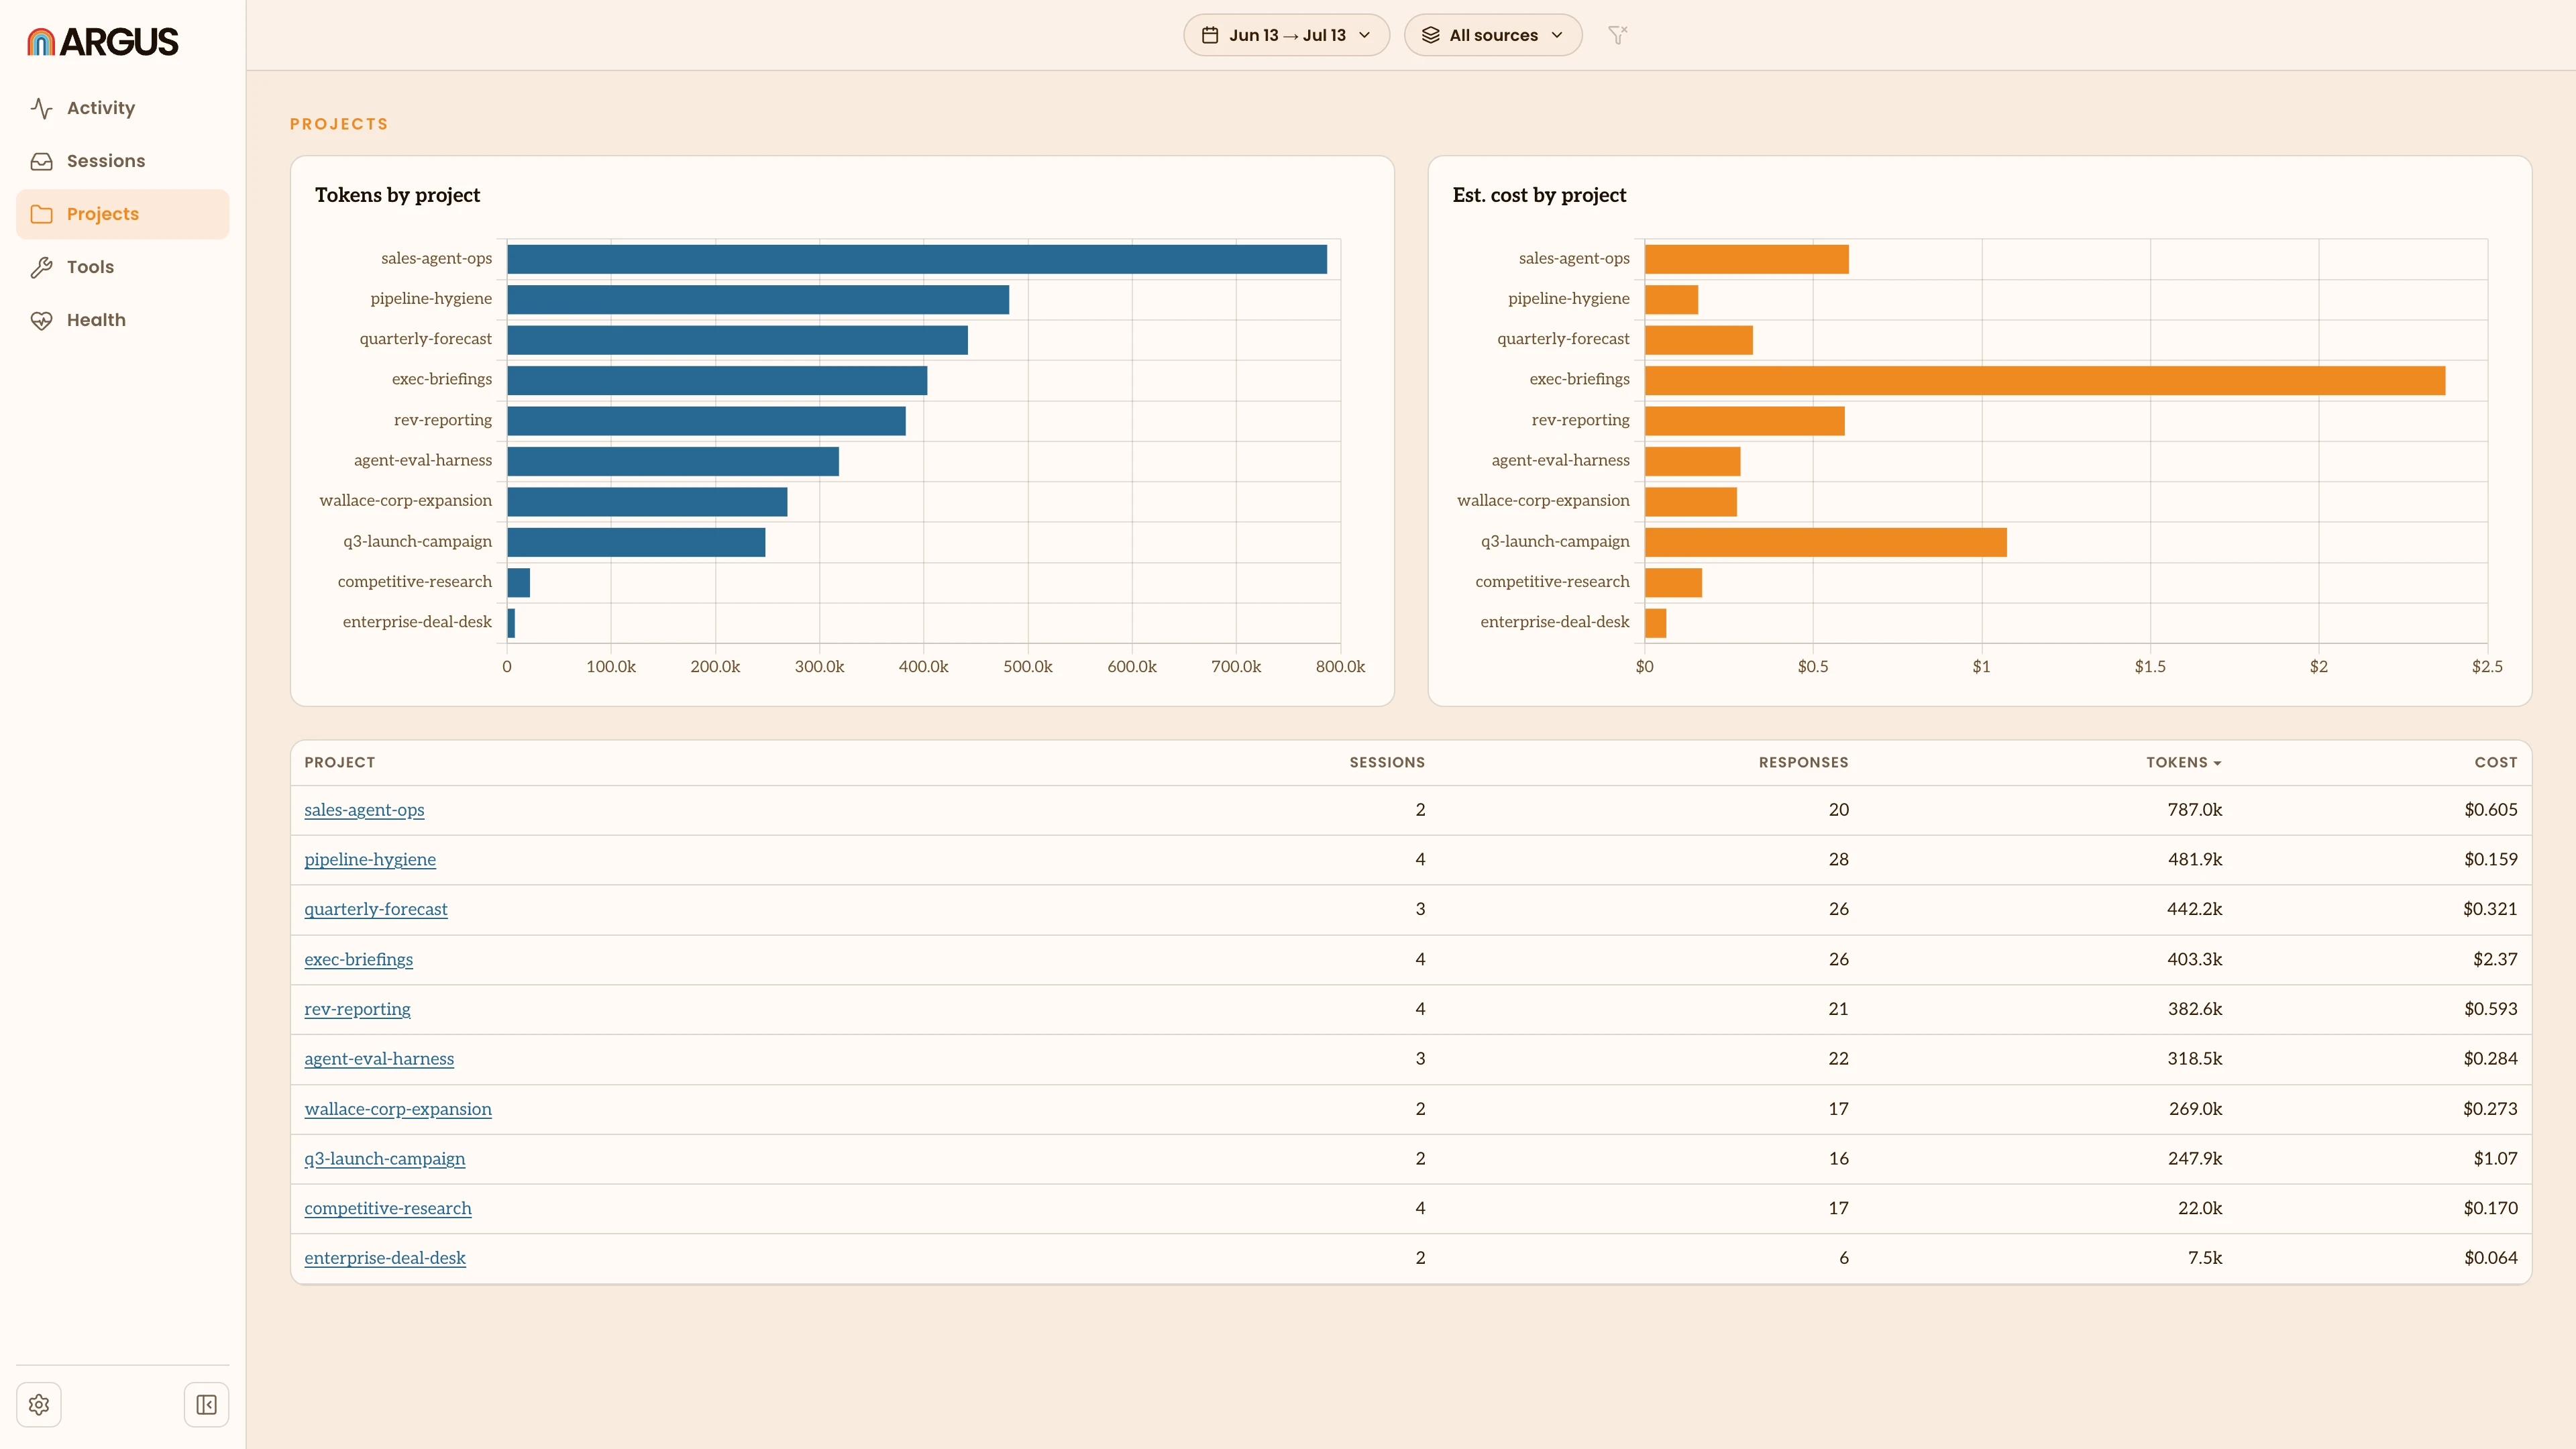
What your agents actually reach for, in four parts:
- Skills: the skills your agents used most, by tokens, and how that use breaks down over time.
- Tools: the tools your agents called most, grouped by category, with how many times each was called and how much content it returned into the agent's context.
- MCP servers and tool output weight: which MCP servers your agents lean on, and which tools return the most content back into context. The heaviest ones are worth trimming, since everything a tool returns takes up space the agent has to read.
- Plugins: the plugins you have installed and whether each is used, enabled but unused, or disabled. The enabled-but-unused ones are candidates to turn off, since every enabled plugin adds to what an agent loads before you even prompt it.
Health
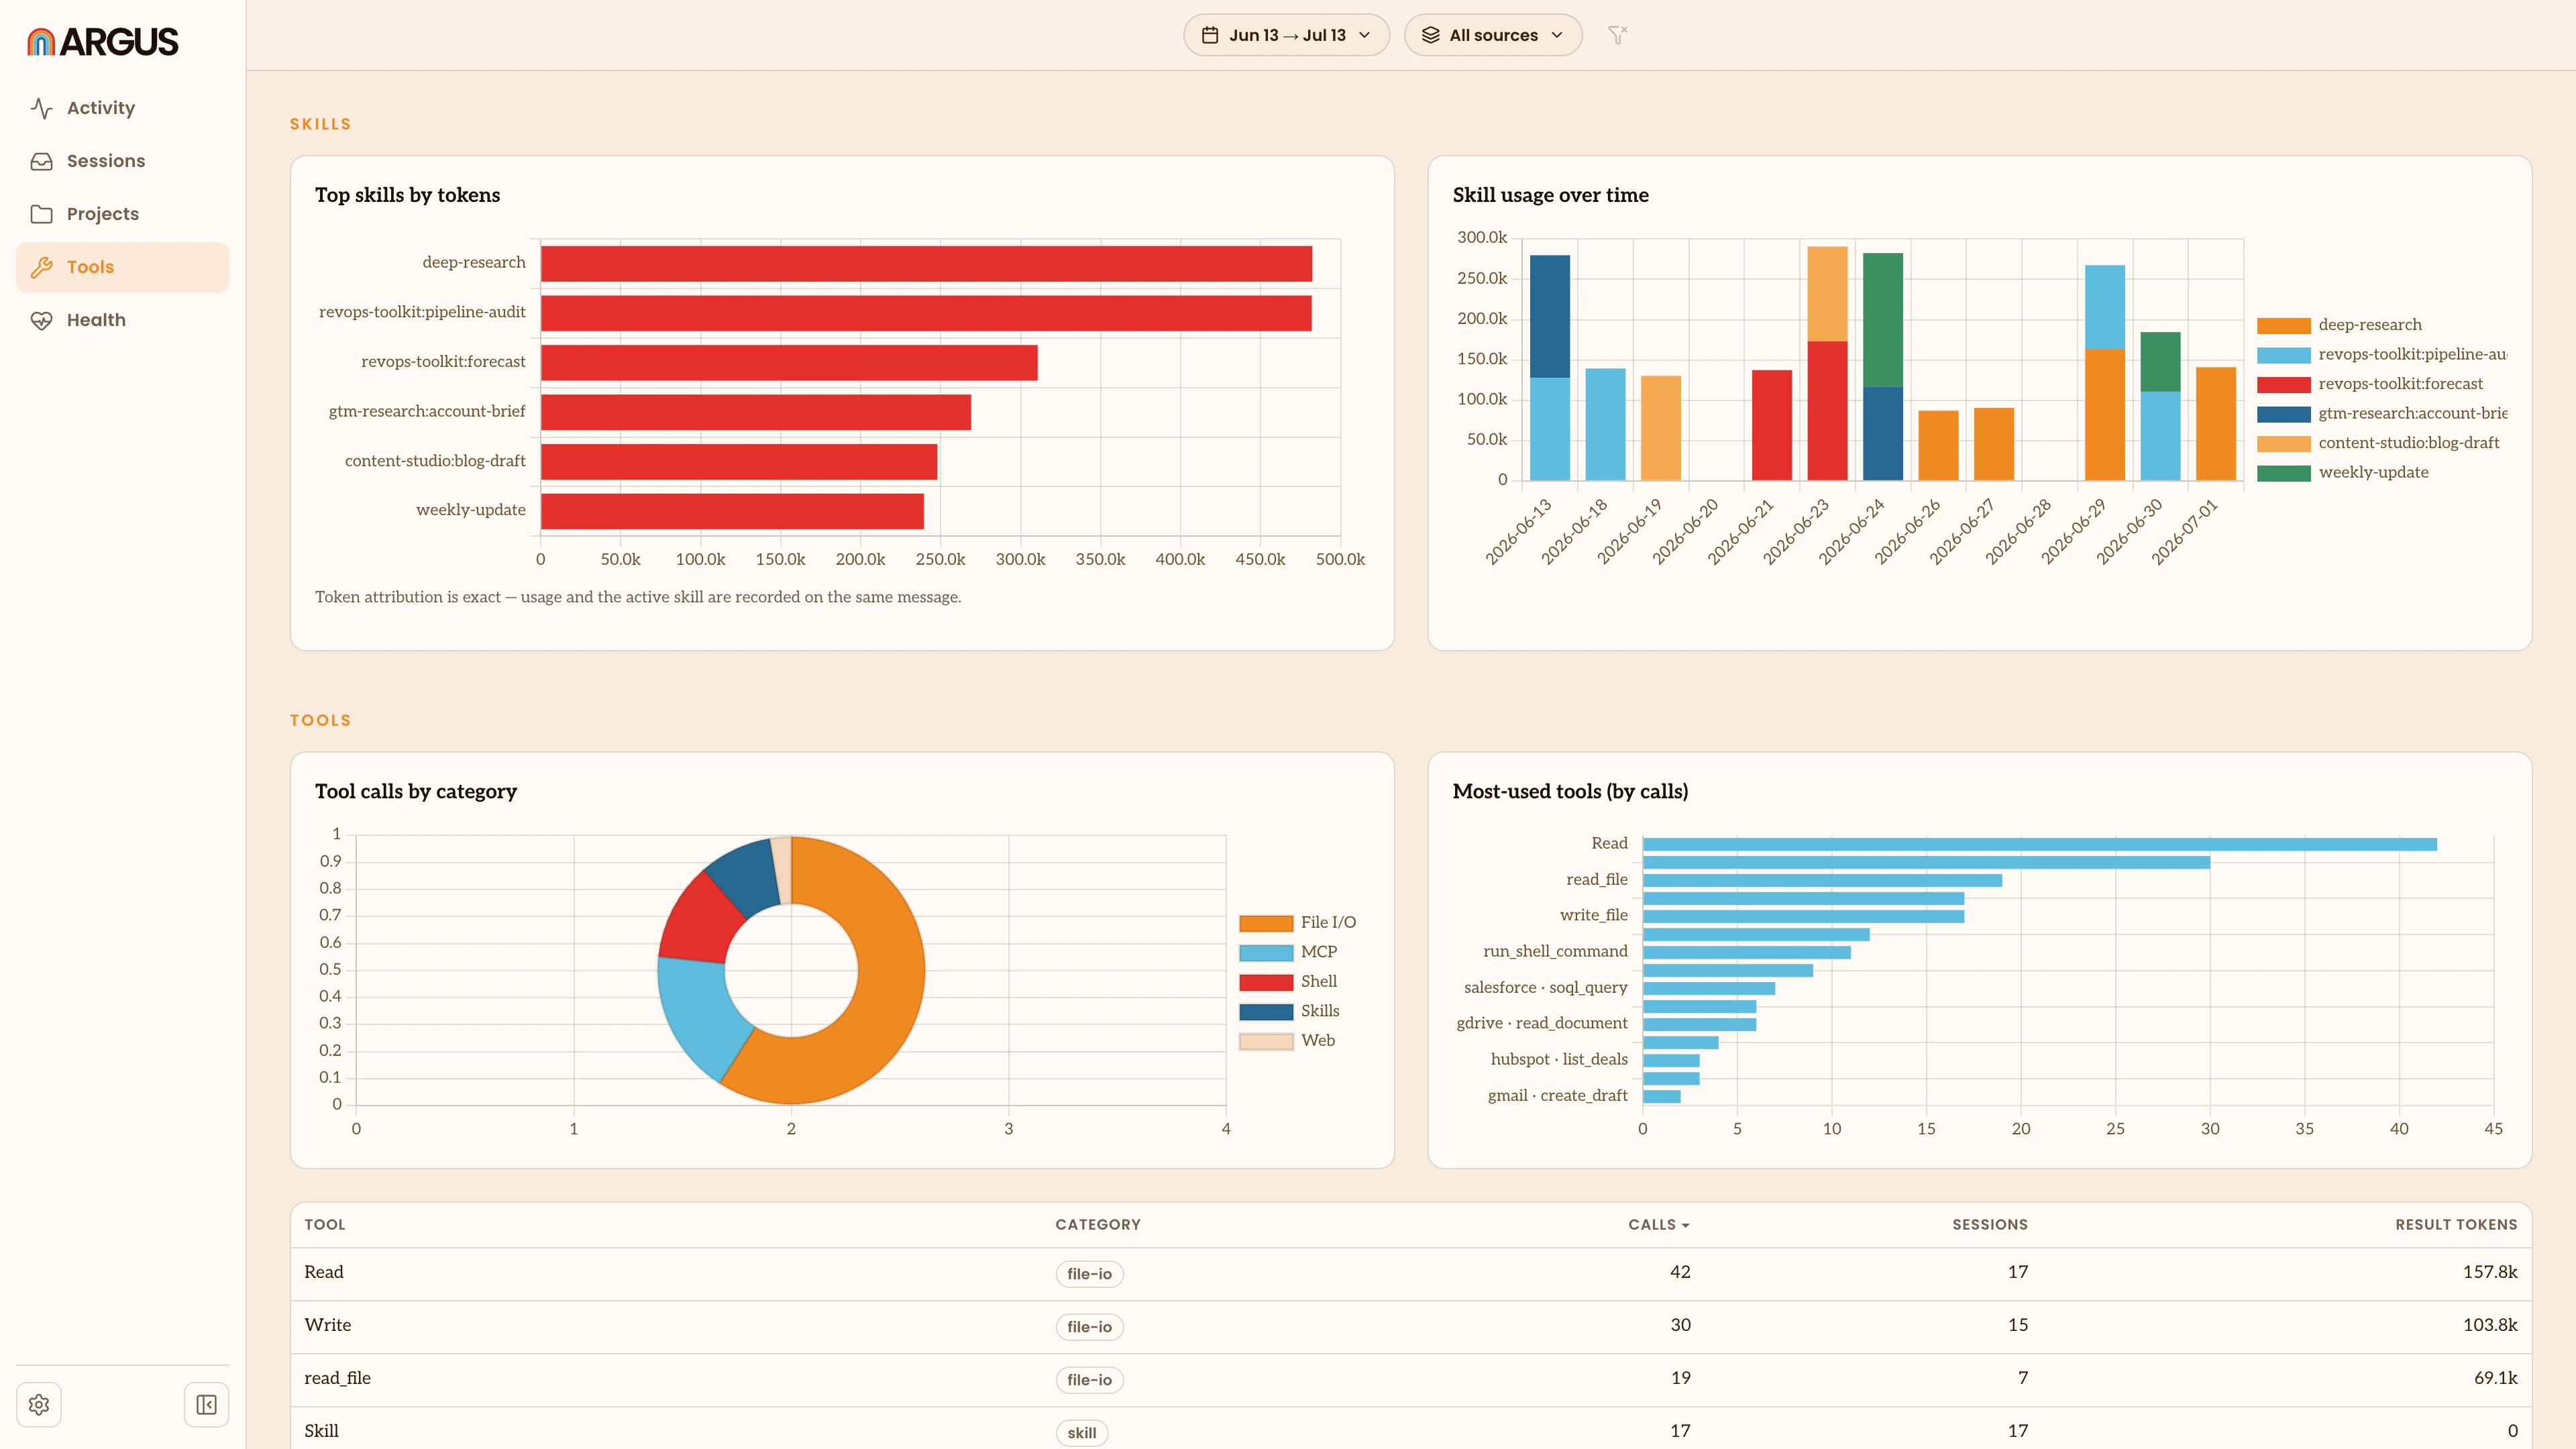
Signs of friction in your sessions: how often you interrupted an agent, how often you declined a tool action it wanted to take, how often a session's context had to be compacted and how long turns took. Totals sit up top and a table breaks the same signals down by project.
Argus measures friction for Claude sessions only, so this view stays empty until you have some. ChatGPT Work, Codex and Gemini CLI sessions don't report these signals.