

Overview
Argus opens in your browser and brings all your AI agent work into one place. This page covers how to get around: the views in the left nav, and the filter that shapes what each one shows.
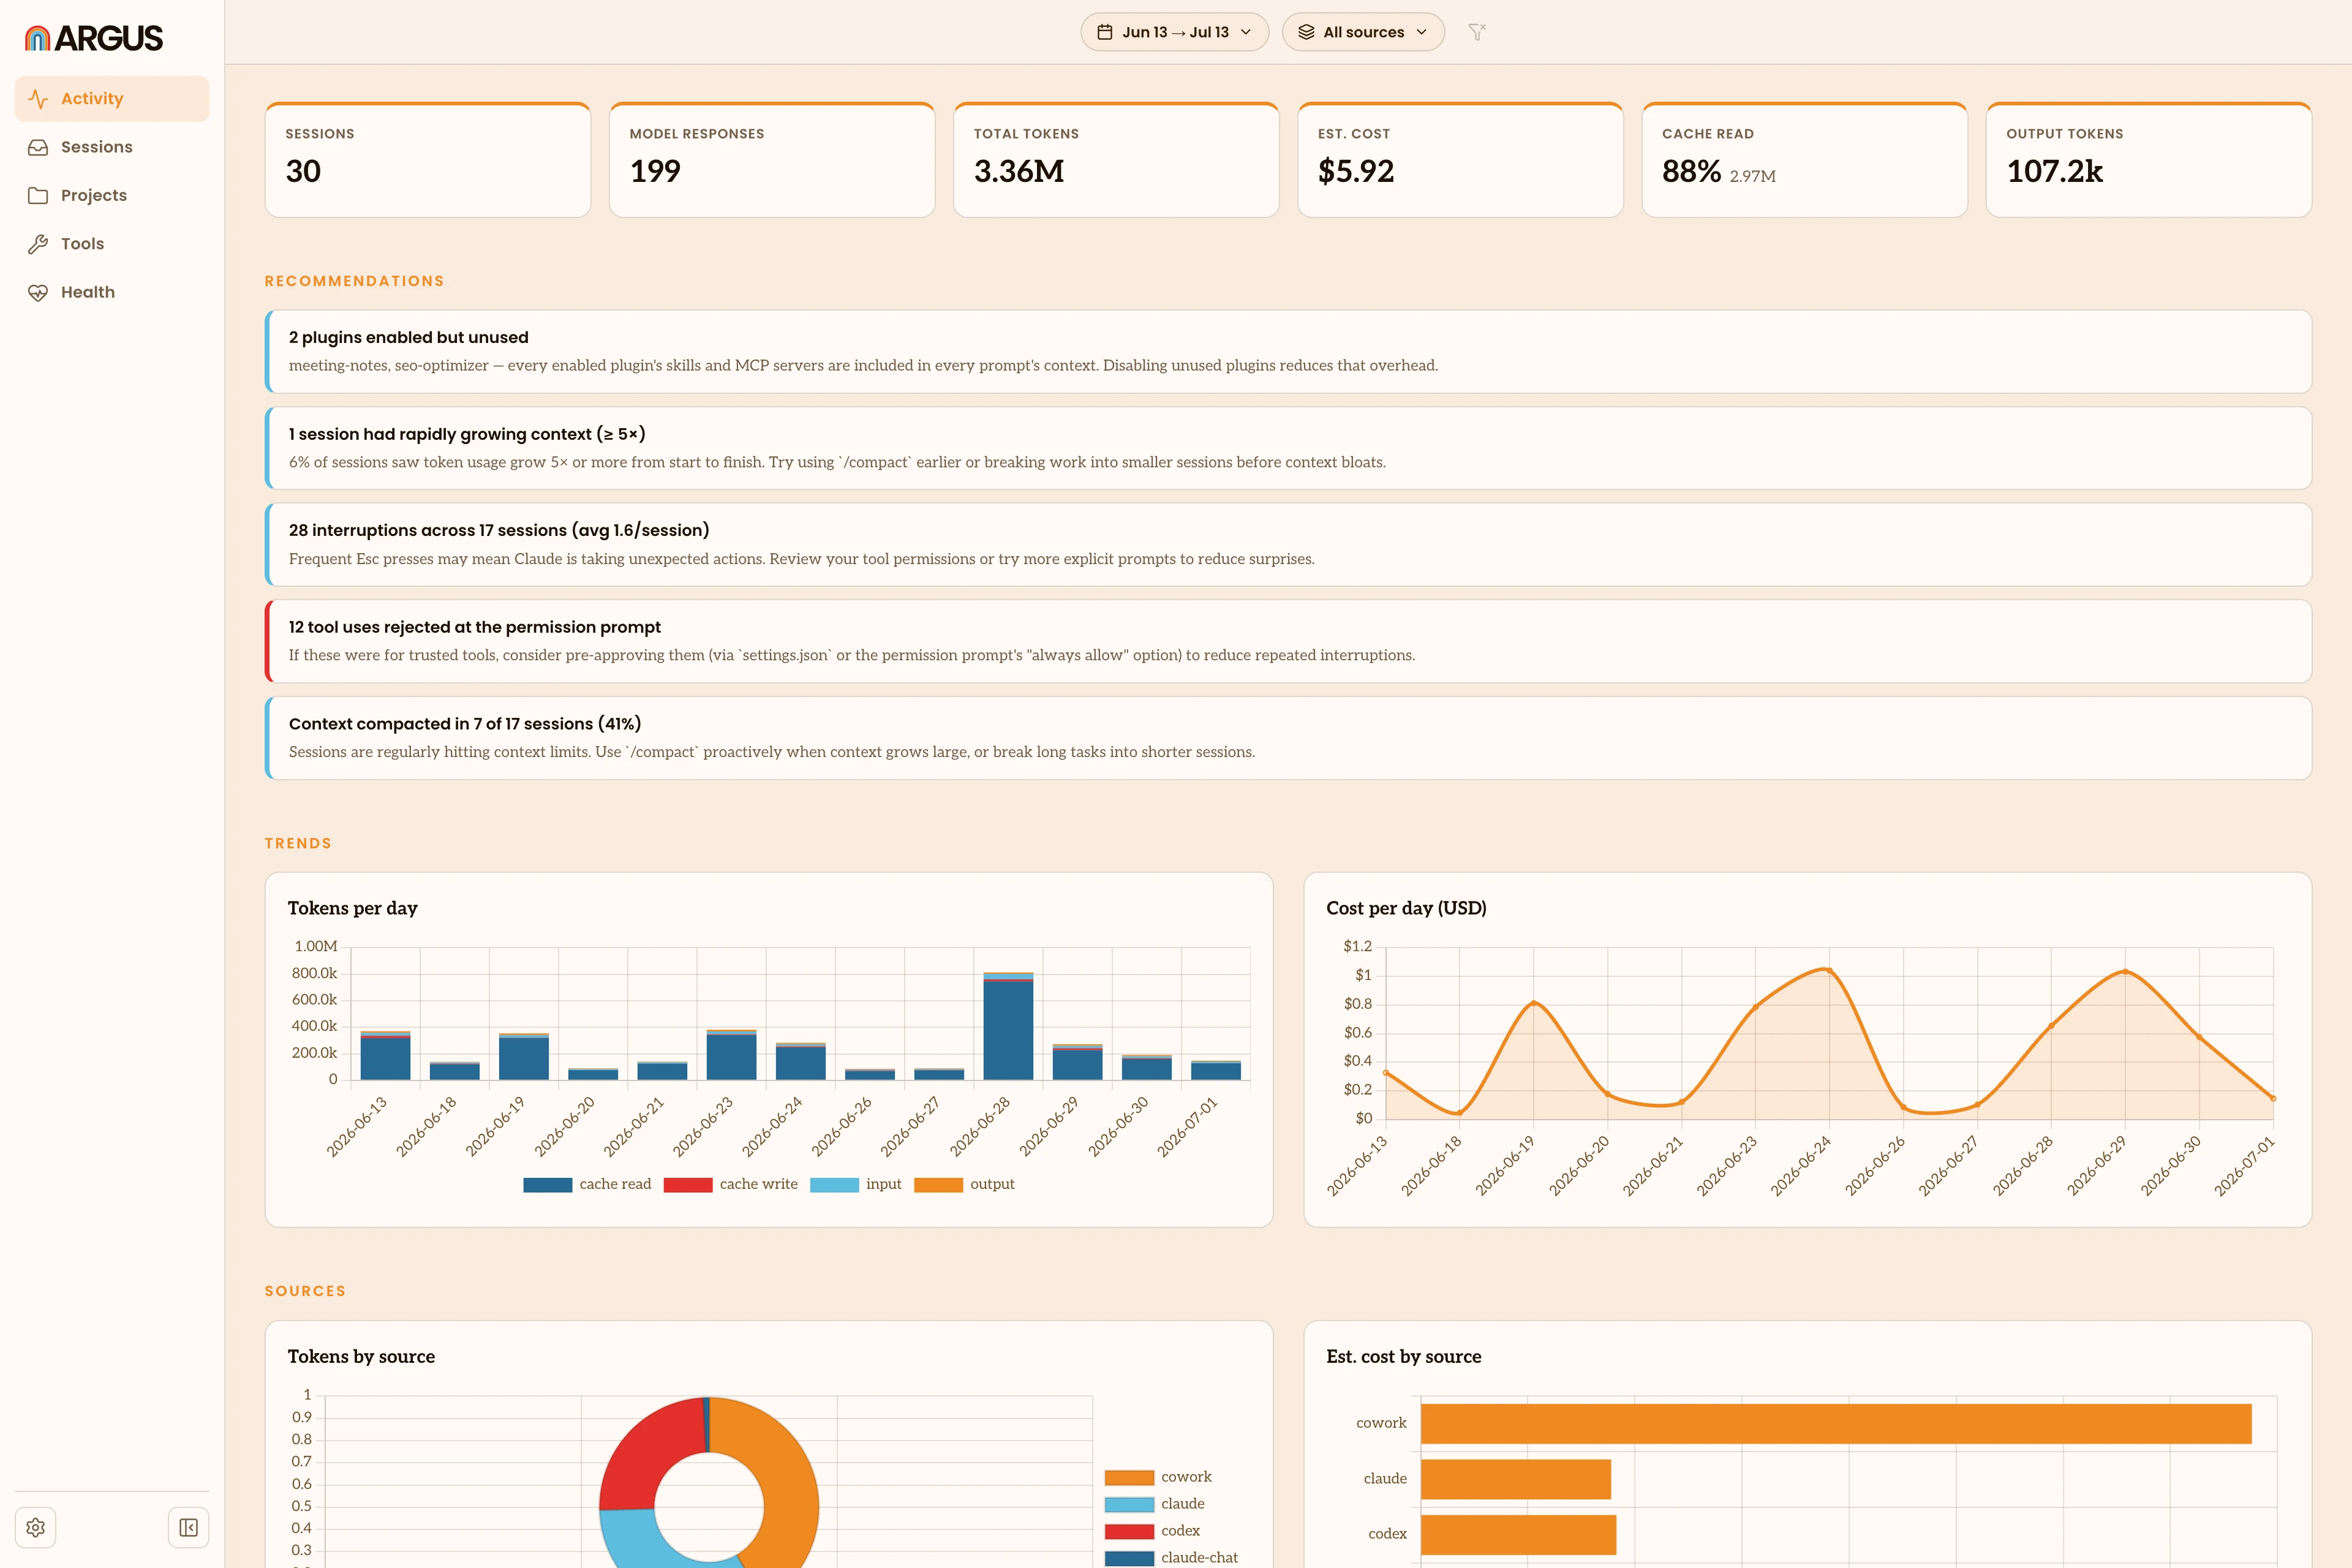
The left nav
The nav down the left side switches between views, top to bottom:
- Activity is the home view: your usage at a glance, with headline totals, recommendations and trends over time.
- Sessions is where you find and read individual sessions in depth: search them, label them, hide the ones you don't need, and open any one to see its tasks and details. See Sessions.
- Projects groups your usage by project.
- Tools shows the skills, tools, MCP servers and plugins your agents use.
- Health surfaces friction in your sessions. It shows an empty state until you have Claude sessions to measure.
Activity, Projects, Tools and Health are the metric views, explained in Metric Views. A gear icon at the bottom opens Settings.
Filters
Two controls at the top of the metric views shape what they show: a date range (a From and a To date) and a source filter. Set them once and they carry across those views, so you can focus on the last week, or on a single agent, without setting them again each time. Argus starts on the last 30 days and all sources, and a Reset button returns to that. The Sessions view has its own toolbar that adds search and labels to the same date and source filters.
Navigation
The views link into each other. Click a project on Projects, or a project in the Health breakdown, and Argus opens the Sessions view already filtered to it, so you can go from a total straight to the sessions behind it.